Know exactly what you earned — and why
Plenty of tools will report your net payout. We prove ours against a control we hold back — and our fee comes out of the difference, so the number has to survive your scrutiny as well as ours.
A plain-language weekly report
Every week you receive a short report you can read in two minutes — no dashboards to decipher:
- Sales & orders — this week vs last, with the reason behind the change in plain language
- Promotion results — what each offer generated in sales relative to what it cost
- Ads efficiency — spend and return on ad spend, per store and per time window
- Net payout — what actually reaches your bank after marketplace fees and marketing costs — the only number that ultimately matters
How do you know the growth was us?
Because we hold a control back. Comparing this month to last month cannot answer the question — a good month might be us, or a competitor closing, or the weather. So we do not rely on it.
If you run several stores, we leave some of them unoptimised and compare the treated stores against them over the same weeks. If you run one store, we alternate: periods where we are active, periods where we are not, on a schedule agreed with you. Either way the market moves for both sides at once, so whatever separates them is our work rather than the season.
A baseline from your recent performance is still agreed in writing before we start, because that is what the fee is calculated on. The control is what tells you the number is real:
- Incremental, not gross — we report the gap between your treated stores and the held-back control, so you never pay for orders you would have had anyway
- Honest reporting — if the treated stores do not beat the control in a given month, we say so plainly, and our fee reflects it. We are paid out of the gap, so we cannot quietly flatter it
- Honest spend decisions — when ads aren't returning, we pause them rather than burn your budget; we've cut clients' daily ad spend by ~30% while growing their sales
One dashboard for all your marketing
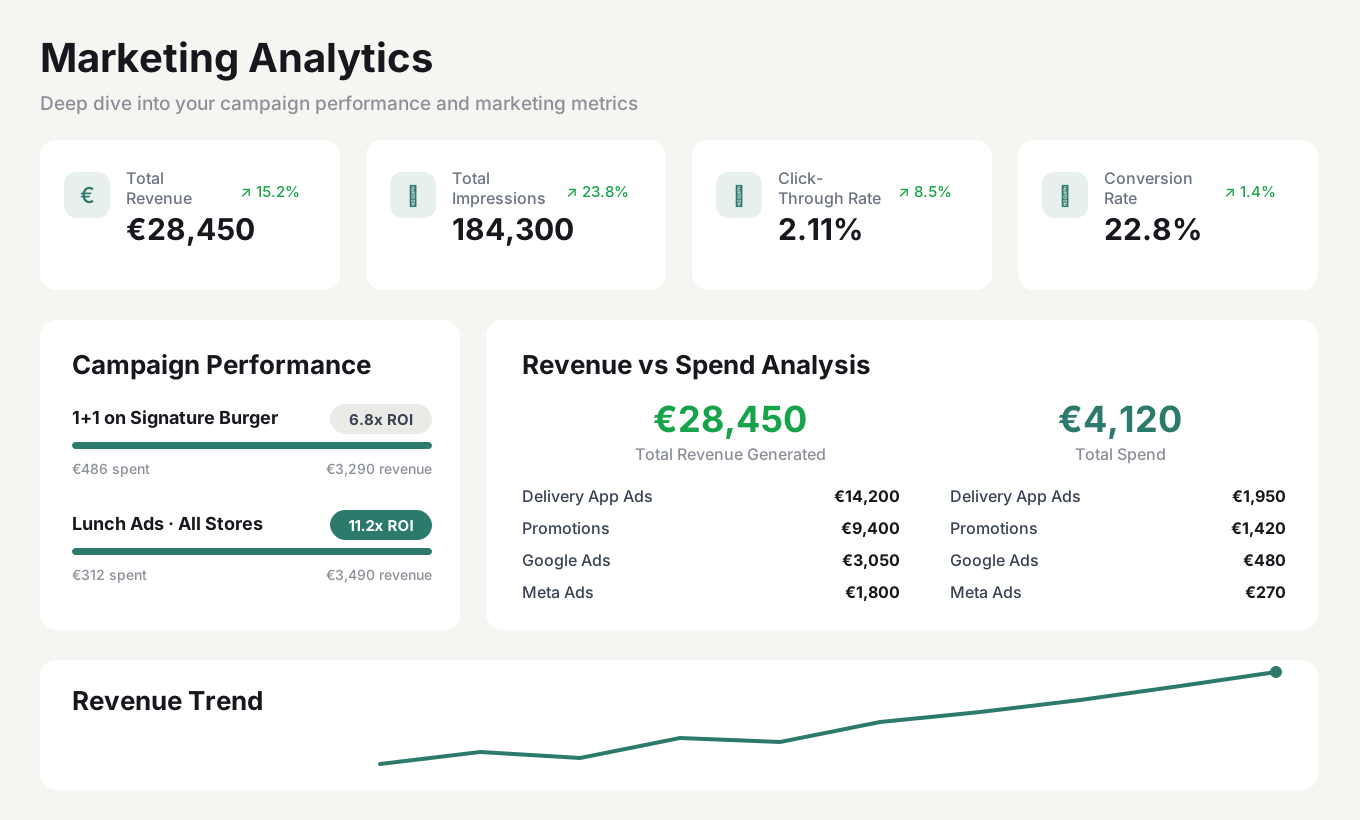
Track campaign performance, revenue versus spend per channel — delivery app ads, promotions, Google Ads, Meta Ads — and your revenue trend, all in one place instead of five separate merchant portals.
3.9x → 13.7x ad ROAS in six months
Real-time, AI-driven ad bidding more than tripled Klaus Schnitzelhaus's return on ad spend — while menu and promotion optimization pushed the brand to a new monthly net payout milestone, with customer retention around 70%.
Get started
See your own store's numbers
before you decide anything.
A 15-minute demo with your real stores on screen — or start smaller: we review one of your delivery storefronts and send you three concrete fixes, no strings attached.
We'd like to use Google Analytics and Google Ads conversion measurement to see which pages and campaigns bring restaurants to us. Both are off unless you accept; we never sell data or use cross-site tracking beyond that. See our Privacy Policy.